

Hydrofabric
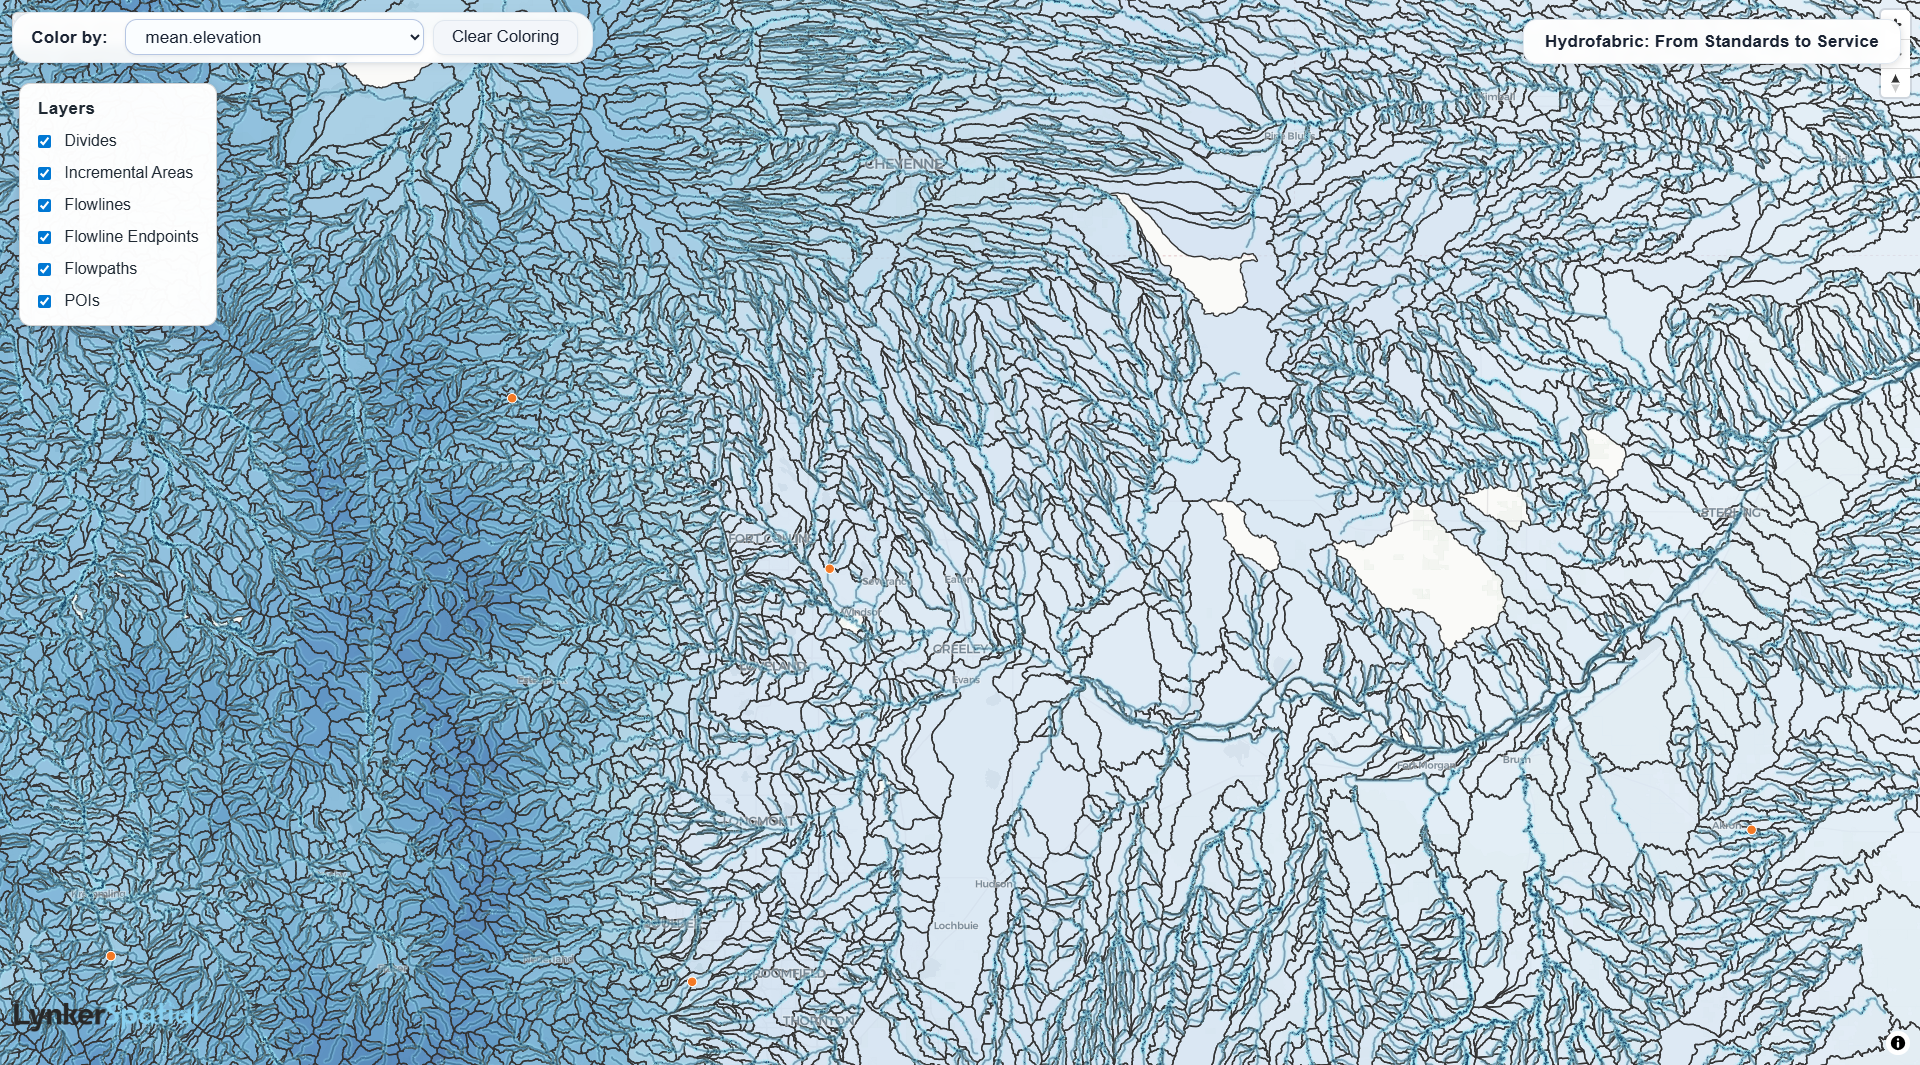
The Lynker Spatial Hydrofabric is a modern, cloud-native framework for next-generation water resource modeling. Developed in close collaboration with NOAA and the USGS, these modular artifacts provide a unified hydrologic system designed for efficient updates, manipulation, and quality control. This framework enables a wide range of modeling tasks while leveraging authoritative input data.
Cloud-Native Data Archives
NextGen hydrofabric artifacts are publicly available through the Lynker Spatial Data Service. By centralizing these datasets in cloud-native formats, users can interact with massive hydrologic networks without downloading the entire national database.
Installation and Setup
To interact with the hydrofabric, we provide a metapackage in R that loads the core hydrologic data science libraries necessary for spatial manipulation, subsetting, and parameter estimation.
You can install the R package directly from GitHub:
# install.packages("remotes")
remotes::install_github("NOAA-OWP/hydrofabric")
library(hydrofabric)
Loading library(hydrofabric) will attach core modular packages, including:
- hfsubsetR: For cloud-based hydrofabric subsetting.
- hydrofab: A toolset for "fabricating" multiscale hydrofabrics.
- nhdplusTools: For network and topology manipulation.
- climateR & zonal: For accessing federated data stores and estimating catchment parameters.
Subsetting the Hydrofabric
The national dataset is massive. Most workflows begin by subsetting the hydrofabric for regions upstream of a specific location (XY), hydrofabric ID, indexed hydrolocation (e.g., NWIS gage), or NHDPlus COMID. Here is how you can quickly extract a subset using hfsubsetR:
# Define the output directory and file
outfile <- "my_catchment_subset.gpkg"

# Build the subset based on a specific COMID
hfsubsetR::get_subset(comid = 101, outfile = outfile, overwrite = FALSE)
Appending Characteristic Data
Once you have your local subset, you can append a wide range of characteristic and forcing data. Through the Lynker Spatial Data Service and open-source tools like climateR and zonal, you can easily summarize variables for your specific catchment set:
# 1. Read your subsetted Hydrofabric
hf <- read_hydrofabric(outfile)

# 2. Fetch Daymet temperature data for your catchments
tmax <- getDaymet(hf$catchments, varname = "tmax", startDate = "2020-10-01")

# 3. Calculate zonal statistics to append to your catchments
summary_stats <- zonal::execute_zonal(tmax, hf$catchments, ID = "divide_id")

head(summary_stats)
For more background information, please see the hydrofabric vignettes.